Metropolitan Family Services FY23 Financials
STATEMENT OF ACTIVITIES
Years Ended June 30, 2023 and 2022
Amounts in 000’s
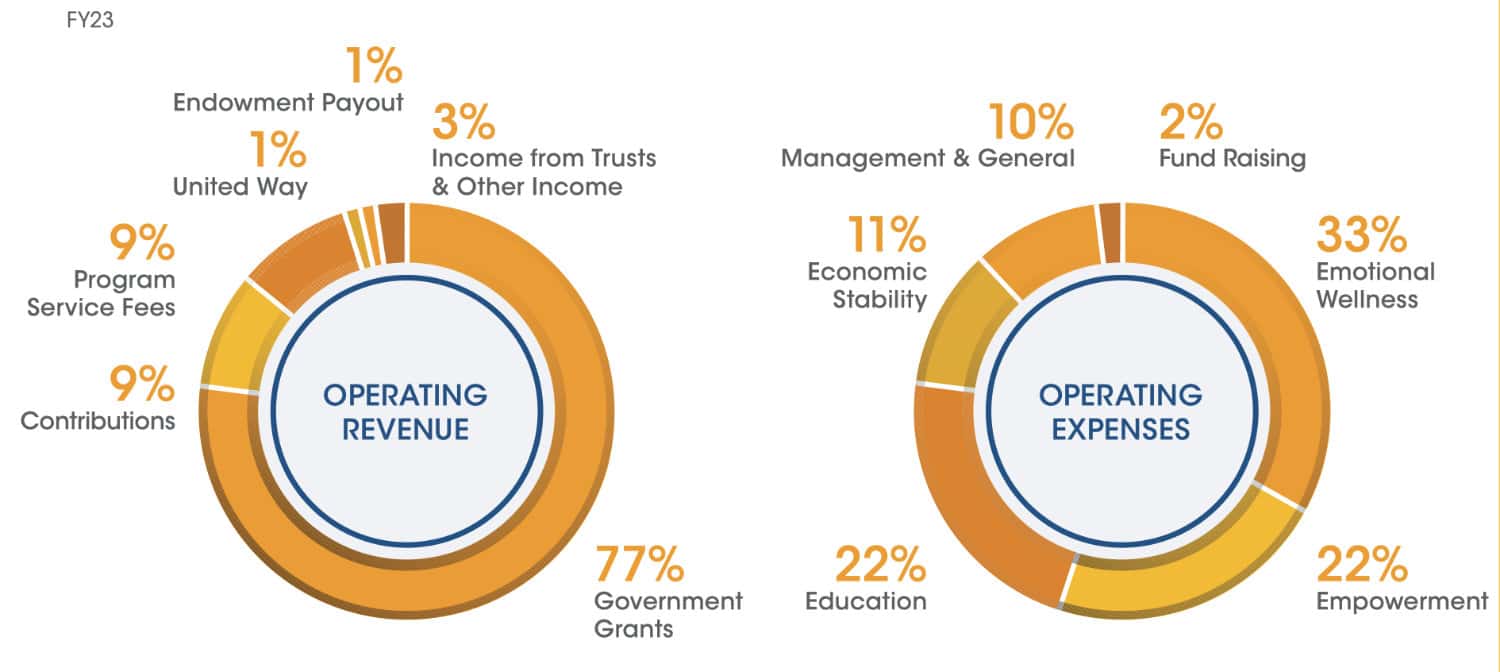
| OPERATING REVENUE | 2023 | 2022 |
| Government Grants | 99,243 | 79,921 |
| Program Service Fees | 11,146 | 8,273 |
| Contributions | 11,760 | 11,518 |
| United Way | 1,382 | 1,403 |
| Endowment Payout | 1,668 | 1,668 |
| Income from Trusts & Other Income | 3,959 | 4,724 |
| TOTAL OPERATING REVENUE | 129,158 | 106,907 |
| OPERATING EXPENSES PROGRAM EXPENSES | 2023 | 2022 |
| Emotional Wellness | 42,694 | 30,599 |
| Empowerment | 28,195 | 27,301 |
| Education | 27,500 | 23,910 |
| Economic Stability | 14,556 | 12,744 |
| Total Program Expenses | 112,945 | 94,554 |
| Management & General | 13,131 | 10,461 |
| Fund Raising | 2,724 | 2,398 |
| TOTAL OPERATING EXPENSES | 128,800 | 107,413 |
| OPERATING SURPLUS (DEFICIT) | 358 | (506) |
| OTHER CHANGES IN NET ASSETS | 2023 | 2022 |
| Depreciation & Amortization | (1,218) | (862) |
| Net Investment Gains (Losses) | 2,663 | 11,995 |
| Change in Pension Liability | 594 | 4,354 |
| Change in Market Value of Interest Rate Swap | 778 | 1,011 |
| PPP Loan | 0 | 0 |
| Inherent Contribution of HACC | 3,279 | 0 |
| Inherent Contribution of I-Grow | 0 | 2,988 |
| Transfer of Assets of I-Grow | (2,868) | 0 |
| Capital Grants | 2,783 | 2,452 |
| Release of Restiction | 1,243 | (797) |
| NON OPERATING ACTIVITY | 7,254 | 5,011 |
| TOTAL CHANGE IN NET ASSETS | 7,612 | 4,505 |
| NET ASSETS AT BEGINNING OF YEAR | 78,407 | 73,902 |
| NET ASSETS AT END OF YEAR | 86,019 | 78,407 |
| Contribution for Goods and Services | 4,236 | 3,245 |
BREAKDOWN OF EXPENSES
FY23
STATEMENT OF FINANCIAL POSITION
June 30, 2023 and 2022
Amounts in 000’s
| ASSETS | 2023 | 2022 |
| Cash | 15,324 | 12,220 |
| Receivables | 28,247 | 20,758 |
| I-Grow assets | 0 | 2,988 |
| Investments | 44,259 | 42,253 |
| Interest in trusts | 17,231 | 16,656 |
| Property and equipment | 31,690 | 22,477 |
| Construction work in Progress | 0 | 3,494 |
| Lease ROU Asset | 10,325 | |
| Other | 1,448 | 1,072 |
| TOTAL ASSETS | 148,524 | 121,918 |
| LIABILITIES AND NET ASSETS | 2023 | 2022 |
| Accounts payable and accruals | 13,147 | 11,218 |
| Investment Bond | 8,500 | 2,500 |
| NMTC Notes | 10,368 | 10,317 |
| Bonds payable | 12,700 | 12,700 |
| Pension liability | (49) | 544 |
| Lease Liability | 10,541 | |
| Other | 7,298 | 6,232 |
| TOTAL LIABILITIES | 62,505 | 43,511 |
| NET ASSETS | 86,019 | 78,407 |
| TOTAL LIABILITIES AND NET ASSETS | 148,524 | 121,918 |